



Q1. Why is employee attrition in India a data problem before it’s a people problem?
Attrition in India is a data problem first because most HR teams react to exits they never saw coming. When headcount, tenure, pay-revision, and engagement data live in disconnected spreadsheets, you cannot spot who is leaving before they have decided. Fix the data foundation, meaning accurate, unified, and real-time, and prediction becomes possible. That is why sector attrition ran near 17% overall in 2025, spiking to 28.7% in e-commerce.
🔎 The scene most HR leaders know too well
Picture a Monday review. The HR head is asked why three good people quit last quarter, and the honest answer is nobody knew it was coming. I have watched teams describe the same trap in almost identical words. As one HR leader put it, the data was so patchy that “we were not sure of the analytics whether the data that was given and analytics through that is it appropriate.”
That doubt is the real starting point. You cannot act on numbers you do not trust.
🏃 The “running around” tax
Before any prediction happens, HR loses days chasing basic records. The lived version sounds like this: “inconsistent data, missing information, which means we have to run around people to say did you update this, did you update that.” Some teams spend a full week each month, with two or three people, just fetching attendance before payroll can run.
That is not a people problem yet. It is a plumbing problem. The exits come later, after the plumbing has already failed quietly for months.
📊 What the data actually says
Here is the reframe. Attrition is a lagging signal, and by the time it shows up, the decision to leave was made weeks earlier. Indian research on machine-learning models trained on local HR data confirms that salary, satisfaction, tenure, performance, and growth fields predict turnover well before resignation.
There is also a sorting rule I lean on. Roughly 20% of exits are genuinely regrettable, while about 80% are not, so the real question is which of those regrettable patterns will repeat in the next twelve months. Chase the 20%. Do not drown in the 80%.
✅ What changes on Monday
Once your data sits in one place, you stop reacting and start ranking. You can sort your workforce by risk instead of waiting for a resignation letter to arrive. That single shift, from cleanup to foresight, is what turns HR from firefighting into planning.
This is where the foundation matters more than any dashboard. At HROne, we see it constantly across the 2,000-plus HR teams we support: attrition analytics only become trustworthy when every employee record lives in one core HCM database, not five spreadsheets that disagree with each other. The tool is not the magic. A single source of truth is.
Karan Jain, who founded HROne, frames the mission as liberating HR’s time and mental space. Bad data is exactly what steals that space. Clean it, unify it, and the people work you actually wanted to do finally has room to happen.
Q2. What is employee attrition, and how do you calculate the rate correctly in India?
Attrition rate = (employees who left ÷ average headcount) × 100. A 1,000-person firm losing 170 people a year has 17% attrition. But the number that matters is not the headline rate. It is regrettable attrition, meaning the people you wanted to keep. Split every exit into voluntary or involuntary, and regrettable or non-regrettable, then track it by manager and tenure band, not just org-wide.
🧮 The formula, with a real example
Start plainly. Attrition rate is the number of people who left, divided by your average headcount, times 100. Average headcount just means (opening headcount + closing headcount) ÷ 2 over the period you are measuring.
So a company that starts the year with 980 people, ends with 1,020, and loses 170, sits at about 17%. That is the featured-snippet answer. It is also where most reports wrongly stop.
🔀 The four buckets that actually matter
A single percentage hides more than it reveals. You need to split every exit two ways.
- Voluntary vs involuntary: did they choose to leave, or did you let them go? Only voluntary exits signal a retention problem.
- Regrettable vs non-regrettable: would you rehire this person tomorrow? A non-regrettable exit is not a loss, it is a correction.
Blend these and a scary 17% can become a calm 4% regrettable-voluntary number. That smaller number is the one worth your energy. As a rule of thumb, expect roughly 20% of exits to be regrettable and 80% not.
📅 Slice by manager and tenure, not just company
Two cuts surface almost all the real signal. First, calculate attrition by manager, because a single team can quietly drag the whole average up. Second, watch the 12-to-24-month tenure band, which is consistently the highest-risk window in Indian firms.
An org-wide rate tells you the building is warm. Manager-level and tenure-level cuts tell you which room is on fire.
💡 Why this matters on the ground
Most teams compute attrition in Excel once a quarter, then argue about whose numbers are right. The math is easy. Keeping it consistent, accurate, and sliceable is the hard part.
This is the everyday job HROne’s workforce management module is built to remove. It tracks attrition analytics natively across the full hire-to-exit lifecycle, so segmentation by manager, tenure, or entity is a filter, not a weekend of spreadsheet surgery. You get the 4% that matters without manually rebuilding the 17% every month.
Q3. Which HR data points actually predict who will leave?
Five fields you already collect predict most attrition in Indian firms: compensation (versus market and last-increment date), job satisfaction, work environment, performance trend, and career-growth or time-since-promotion. Layered signals sharpen it, including burnout markers (zero leave in 6-plus months, overtime hours), commuting distance, recognition history, and pulse-survey sentiment. You do not need a data-science team to start. You need these columns in one sheet, ranked.
🎯 Why “engagement tips” predict nothing
Generic advice about being more engaging is not a signal. It is a wish. A prediction needs a measurable field that moves before a person resigns, and vibes do not qualify.
The standard read gets this backwards. It treats prediction as a mood, when it is really a small set of numbers you probably already have.
📈 The five fields that carry the weight
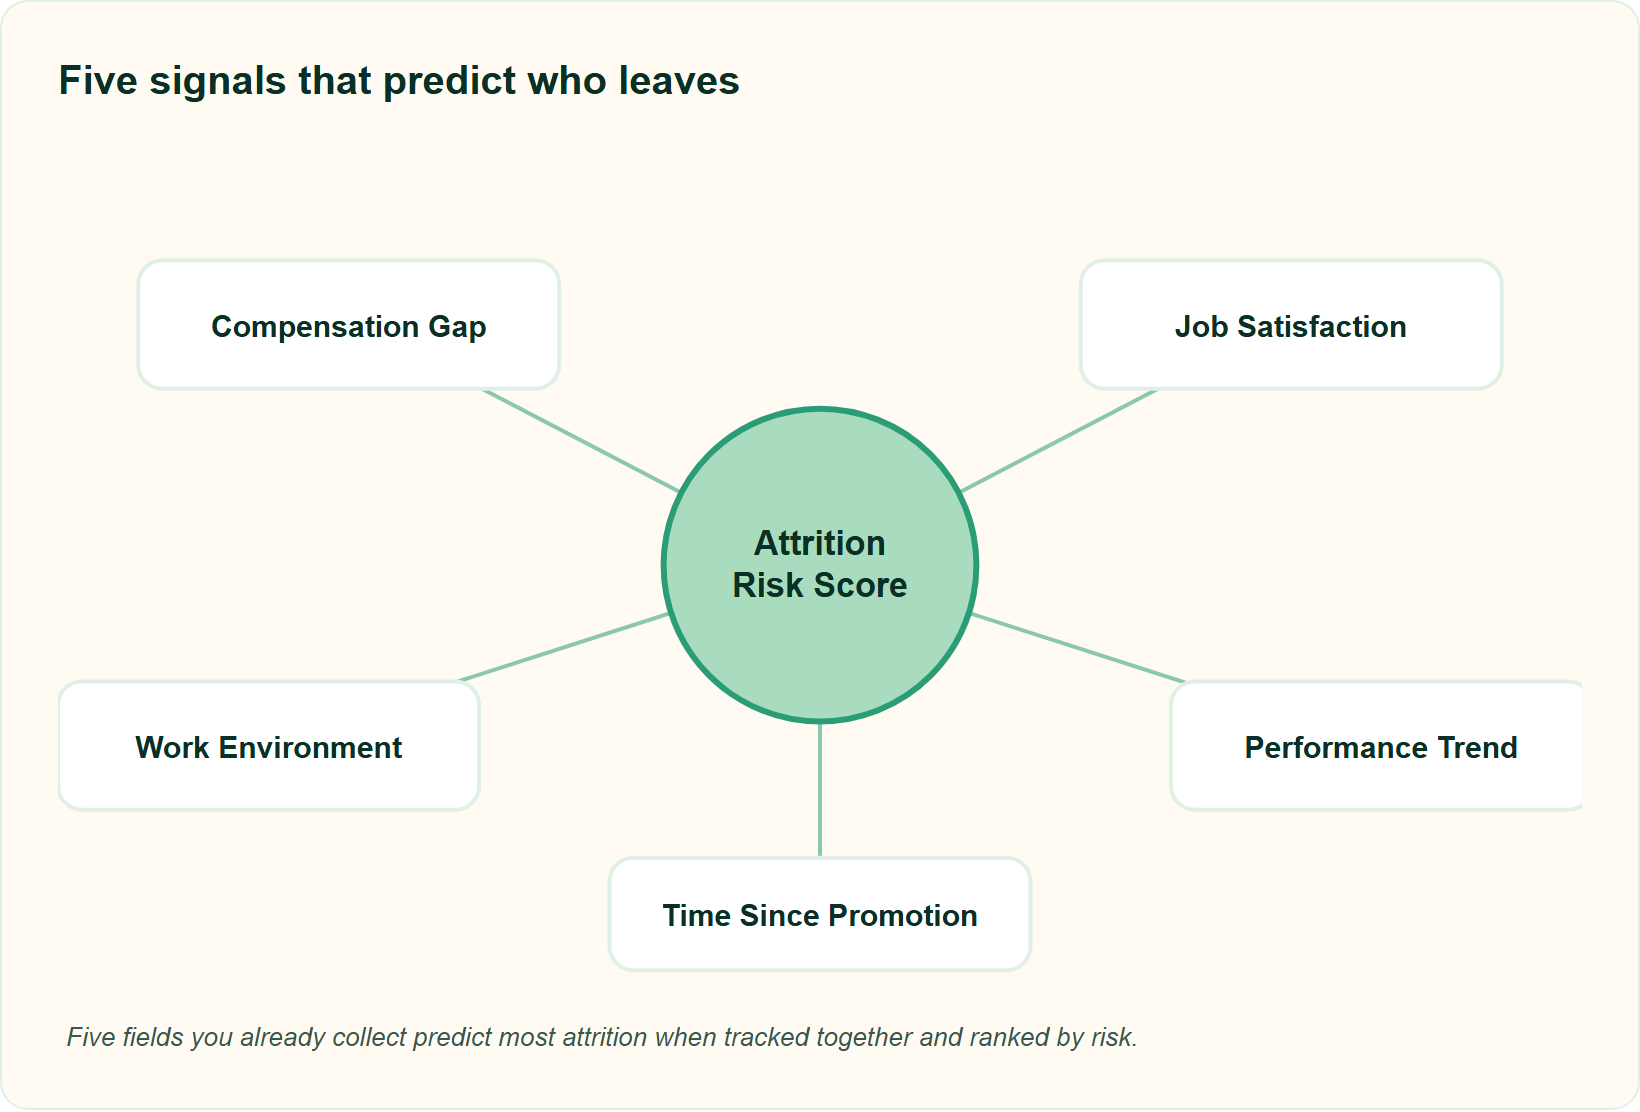
Indian machine-learning research on local HR data keeps landing on the same core predictors: salary, job satisfaction, work environment, performance, and career growth. A separate India study confirms these features materially improve turnover-prediction accuracy.
Translated for Monday morning, that means five columns:
- Compensation, compared to market and to months since last increment.
- Job satisfaction, from your last pulse survey.
- Work environment or manager-relationship score.
- Performance trend, not just the latest rating.
- Time since last promotion or role change.
🔬 The layered signals that sharpen it
The base five get sharper when you add behavioural markers. Burnout is measurable, not just a feeling. Academic work using predictive models shows emotional-exhaustion signals like sustained overtime and zero leave taken in six-plus months flag rising turnover intent.
A Tata Consultancy Services patent for attrition-risk scoring goes further, weighting triggers like commuting distance, recognition history, and growth curve into one risk flag. Older Indian research is also honest about the limits: on imbalanced data, chase recall (catching real leavers), not headline accuracy.
📋 Build the one-sheet risk view
Here is the part I keep returning to. Software does not create culture, and data does not make the call. Data predicts, humans decide.
So a survey that only measures “satisfaction” is nearly useless. A good one measures employee engagement, personal growth and development, values (personal versus organizational), and collaboration. That five-metric standard is what feeds a real risk score, not a happiness sticker.
This is exactly the data-capture layer we obsess over at HROne. The employee engagement module runs mood bots and pulse surveys, while the performance management module tracks KRA and KPI trends over time, so the five predictive fields and the layered signals land in one view instead of five tools that never talk. The point is not fancy AI. It is having honest, current signals in one place so a human can act early.
Q4. Why do most retention strategies in India still fail?
Most retention strategies fail because they are built on exit-interview data employees were never honest in. People give safe reasons (“better opportunity”) and hide the real driver, which is usually the manager. Data shows 62% of Indian exits are controllable, with supervisor behaviour the single biggest cause. The second failure is designing HR for equality instead of equity, because uniform policies feel fair but ignore that a field executive and a payroll analyst need different things.
🎈 Most people think perks fix attrition. They are wrong.
The popular playbook says add engagement activities, throw a few parties, and people will stay. I understand the appeal. It feels active, visible, and cheap.
But pizza does not fix a broken manager relationship. Generic “pizzas and office parties” advice is the clearest tell that a retention plan is treating a symptom, not the cause.
🕵️ The flaw: your exit data is quietly lying
Here is where it breaks. Exit interviews collect their most important data at the exact moment an employee has the least reason to be honest. They protect references and relationships, so they say “growth opportunity” and move on.
The real picture is sharper. Long-run Indian exit-interview data across hundreds of organizations shows about 62% of exits are controllable, and supervisor behaviour is the single biggest reason people leave. If your strategy never names the manager, it is solving the wrong problem.
⚖️ The second flaw: equality feels safe, equity works
Most HR systems did not fail because they were unfair. They failed because they were too uniform. Equality feels safe, so we apply one policy to everyone and call it just.
But a field sales executive and a payroll analyst do not have the same risks, needs, or friction. Designing for equity, meaning the right policy for the right context, is harder and far more stable. I might be overstating it, but from what surfaces when you actually run this, uniformity is the quiet killer nobody audits.
✅ The better strategy: signals over surveys
So swap the annual exit autopsy for two live habits. Run stay interviews while people are still deciding, and watch leading signals (manager scores, time-since-promotion, burnout markers) instead of waiting for the resignation.
Then act by manager, not by memo. The repeat-offender manager is usually hiding in plain sight inside your own data. This is why continuous feedback over annual reviews tends to catch problems earlier.
This is the practical reason configurability matters more than it sounds. At HROne, the policy engine and custom roles let HR run different, compliant rules for field teams and office teams inside one HR solution, so “equity, not equality” becomes an actual workflow instead of a slogan. You design for the real difference between roles without creating five disconnected rulebooks nobody can track.
Q5. How much does employee attrition really cost an Indian company?
Replacing an employee costs 50% to 200% of their annual salary once you count hiring, onboarding, lost productivity, and knowledge drain. A 200-person Indian firm at 20% attrition on an average ₹8L salary bleeds roughly ₹3.2 crore to ₹6.4 crore a year. Add the hidden tax: nearly 50% of employees consider leaving after just two payroll mistakes, so data inaccuracy is itself a cost centre.
💰 The number your CFO actually needs
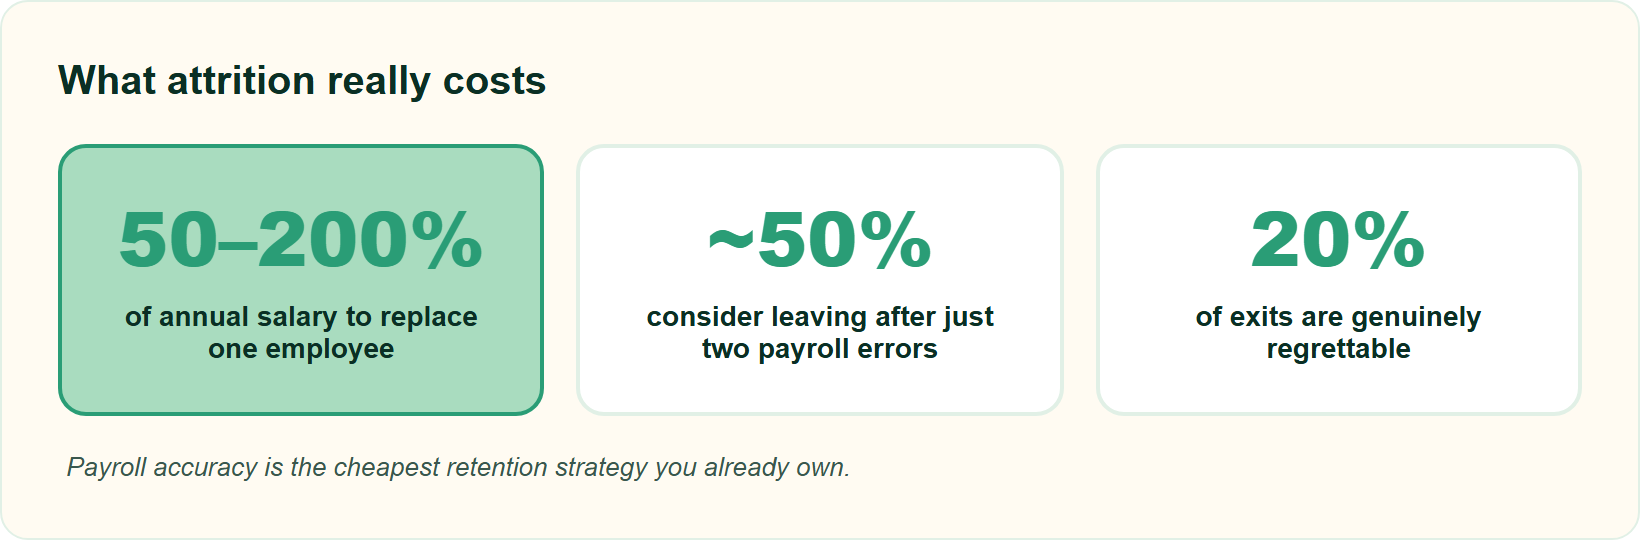
Start with the direct math. Every exit costs between 50% and 200% of that person’s annual salary, once you add recruitment fees, onboarding time, and the ramp before a replacement is productive.
Run it for a real firm. Take 200 people, 20% annual attrition, and an ₹8L average salary. That is 40 exits, and at even a conservative 50% to 200% replacement cost, you are looking at ₹3.2 crore to ₹6.4 crore leaking out every year. You can pressure-test your own figure with an ROI calculator.
💸 The hidden tax nobody puts on a slide
Here is the part that gets missed. Payroll accuracy is a retention lever, not just a finance chore. Nearly 50% of employees consider leaving after just two payroll mistakes.
I put it bluntly with peers: missed payroll equals trust broken, and underpaid equals a legal violation. When a UK retailer delayed bonus payments in 2020, thousands of staff were affected, and the morale and reputation damage was public. A wrong payslip is not a glitch. It is a resignation trigger, which is why payroll automation that reduces errors matters so much.
⚠️ Two ways attrition drains cash
- Visible drain: rehiring, retraining, and the productivity gap while a seat sits empty.
- Invisible drain: payroll errors, delayed dues, and broken trust that quietly push good people toward the door.
✅ Turn it into one board-ready line
Give leadership a single sentence. “At X% attrition on our average salary, we are losing roughly ₹Y crore a year, before counting payroll-trust damage.” That framing moves budget faster than any engagement survey.
Accuracy, honestly, is the cheapest retention strategy you own. This is where our payroll software earns its place at HROne. Group payout validations and a two-level approval step catch errors before salaries go out, and statutory calculations for PF, ESI, and TDS run automatically, which is exactly why users report error-free disbursement.
“I like HROne for its zero-touch payroll and compliance automation. It handles salary calculations, statutory deductions PF, ESI, taxes, and filings automatically, with zero manual intervention, removing payroll errors and compliance anxiety during audits.”
— Waldon S., HROne G2 – Verified Review
“I also love the automated payroll. Juggling spreadsheets was always a nightmare, but now I dont have to do that since its centralized in one place.”
— John C., HROne G2 – Verified Review
Stop payroll-triggered exits, and you have already recovered a chunk of that crore-scale leak.
Q6. How do you build an attrition early-warning system using HR data?
Build an early-warning system in five steps: (1) unify your HR data into one source; (2) pick weighted risk triggers (pay gap, months since promotion, burnout markers, manager, and commute); (3) score each employee into a cumulative risk flag; (4) route high-risk alerts to a named owner; and (5) pair every flag with a specific action, not just a report. Start in a spreadsheet, then automate.
🛠️ By the end of this, you can build one this week
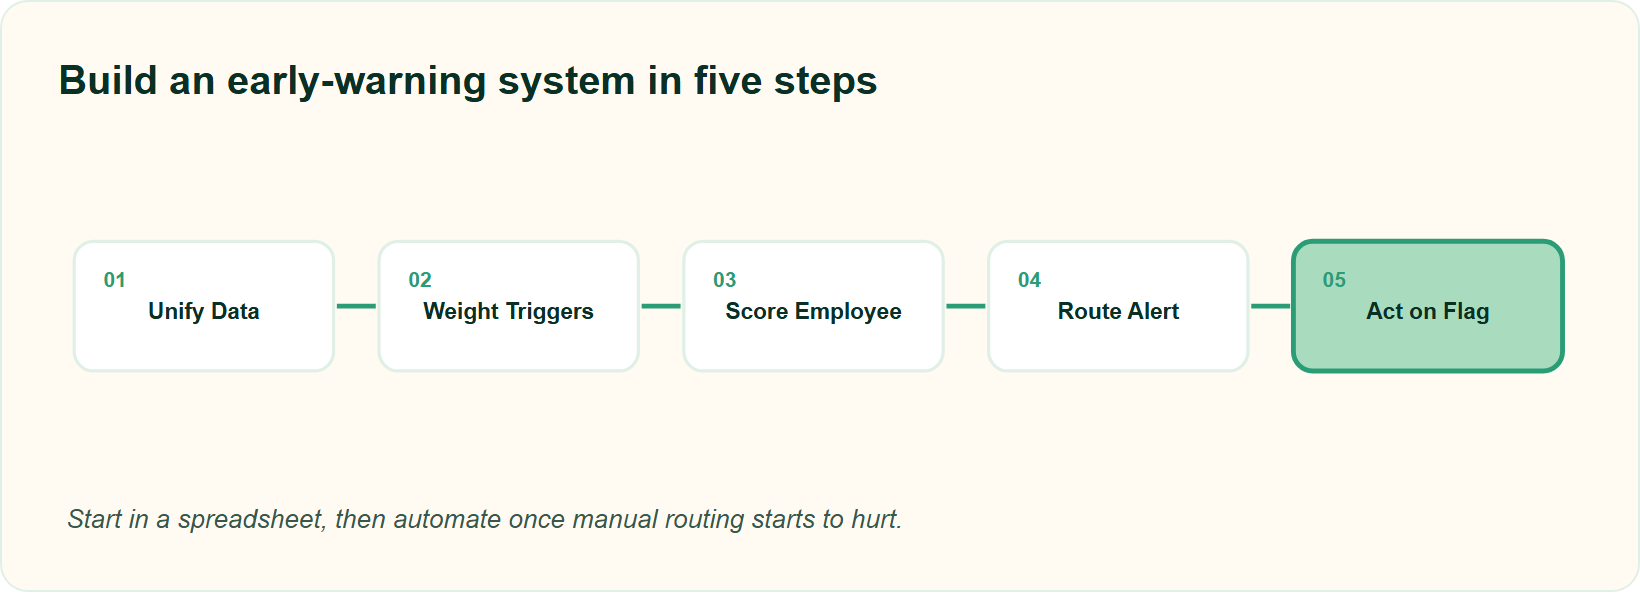
You do not need a data-science team. You need five disciplined steps and the willingness to act on what surfaces.
Step 1: Unify the data. Pull headcount, tenure, pay-revision dates, and pulse scores into one sheet. Scattered data is the single biggest reason early warnings never fire, so a unified core HCM record helps.
Step 2: Pick weighted triggers. Not every signal weighs the same. A Tata Consultancy Services patent for attrition-risk scoring weights triggers like commuting distance, recognition history, and growth curve into one score.
⚖️ Why weighting beats a single flag
A single flag (“no promotion in 2 years”) misses people. A weighted score combining pay gap, manager, burnout, and commute catches far more, because attrition is rarely one cause.
Step 3: Score each person. Turn the weighted triggers into one cumulative risk number per employee. Sort high to low, and your at-risk list writes itself.
Step 4: Route the alert to a human. The same patent auto-notifies HR when a score crosses a threshold. A newer flight-risk patent goes further, reading pulse and message sentiment, then retraining on outcomes. An HR inbox makes that routing clean.
🎯 Step 5: Pair every flag with an action
A report nobody acts on is theatre. Research on linking risk to intervention shows the fix is pairing each flagged employee with a specific move, like an L and D nudge or a career conversation.
Here is what I got wrong early. I chased model accuracy, when recall (catching real leavers) matters more on lopsided data where leavers are rare. Do not wait for annual reviews either. An “instant pat on the back” habit works, and one team reported engagement climbing from 25% to 125% after adopting everyday recognition, which is the case for real-time feedback.
This is the part we automate at HROne. Attrition analytics score the risk, the Super Inbox routes each alert to a named owner in three clicks, and the employee engagement module’s recognition tools turn a red flag into a same-day action.
“The InboxforHR is a game-changer, centralizing every HR task into one simple inbox, cutting down administrative time by 6070 and preventing tasks from falling through the cracks.”
— Waldon S., HROne G2 – Verified Review
“The system itself sends reminder to me to complete them on time. I also like the way HRone maintains process discipline… it doesnt allow the process to move forward until the checklist is fully completed.”
— Bindu P., HROne G2 – Verified Review
Start in Excel today. Automate it the week the manual routing starts to hurt.
Q7. Can HR software actually reduce attrition, or is that a myth?
Software alone does not reduce attrition. It makes the culture you have already built consistent and scalable. A platform ends the run-around for data and frees HR time, but the cultural work (job descriptions, performance framework, and values) is a 36-month scope, not a 3-month install. Buy software to remove friction and surface signals. Do not buy it expecting it to create belonging.
❌ The myth vendors love to sell
The pitch is seductive: buy the platform, watch attrition drop. I have sat on the other side of that promise, and it is only half true.
Software does not create culture. If you do not have culture by design, you get culture by default, where the loudest operator in the field sets the tone. It helps to know the HR software misconceptions versus the reality.
⏰ The honest timeline nobody quotes
Here is the uncomfortable part. Real cultural work, building job descriptions, a performance framework, and shared values, runs closer to a 36-month scope, not the 3 months on the sales deck.
I have watched the implementation scar too often. A team buys a system believing it will do something, pays the setup fee, allocates people, then discovers it cannot do what they assumed. Think of a Ferrari: the car is fast, but if you never train the driver, you burn the clutch.
⚠️ Where software genuinely helps vs where it stops
📋 What HR Software Can and Cannot Do for Attrition
| Software CAN do | Software CANNOT do |
|---|---|
| Make good policy consistent and repeatable | Invent the policy or the culture |
| Free HR time (one team cut occupancy from 150% to 70%) | Replace a manager relationship |
| Surface risk signals early | Decide what to do about them |
✅ So what should you actually buy it for
Buy software to remove friction, standardise what works, and surface signals early. That is a real, bounded win, not a miracle.
I might be overstating it, but the category quietly oversells this, and honest vendors should say so. At HROne, we position the platform as the consistency-and-time-back layer with 127 workflows, the Super Inbox, and an ROI dashboard that quantifies hours saved. It complements cultural design. It does not replace it. The honesty is the point, and choosing well starts with knowing how to choose the best HRIS HRMS software.
“The software frees up my team to focus on employee engagement and retention strategies instead of manual data updates. I find the HR Analytics particularly valuable for presenting data to management.”
— Priyanka S., HROne G2 – Verified Review
“Some modules, especially Payroll and Performance, have a learning curve and require more detailed guidance for first-time users. Certain workflows involve many steps, which can make simple tasks slightly time-consuming.”
— Shilpi M., HROne G2 – Verified Review
That second review is fair. Tools take time to master, which is exactly why the culture work underneath still matters most.
Q8. Which Indian labour laws turn attrition and exits into compliance risk?
Exits are not just an HR event. They are a compliance clock. Under India’s new wage codes, full-and-final dues (the last salary plus all pending payments, called FnF) must be cleared within two working days of an employee’s last day. Add multi-state PF, ESI, and TDS obligations, plus POSH and Maternity Benefit compliance, and a messy exit becomes legal and reputational risk. Time-box your exit workflow, or the delay drives grievances.
⏰ The two-day clock most teams miss
Let me define it plainly. Full-and-final settlement (FnF) means every rupee you owe a leaving employee: final salary, unused leave encashment, and any dues.
Under India’s Code on Wages, 2019, and the new labour codes, that FnF must be paid within two working days of the last working day. Miss it, and a routine exit becomes a statutory breach. As I say to peers, underpaid equals a legal violation, not a rounding error, so statutory compliance in payroll is non-negotiable.
📋 The compliance web behind every exit
An exit touches more than final pay. Each of these carries its own India-specific rule.
- PF (Provident Fund) and ESI (Employees’ State Insurance): contributions and settlement must be filed correctly, often across multiple states.
- TDS (Tax Deducted at Source): the final Form 16 and tax computation must reconcile.
- POSH and Maternity Benefit Act: compliance gaps here create grievance and legal exposure that quietly fuel attrition.
⚠️ Why delay itself drives attrition
A delayed settlement does not just risk a penalty. It tells your current employees how they will be treated on their way out, and that story spreads fast.
✅ Time-box the exit, cut the grievances
The fix is boring and effective. Put a clock on every exit step, so clearance, dues, and documents finish inside the statutory window. A structured onboarding process and its exit mirror both benefit from this discipline.
There is a rights angle too. Employees have a legal right to their own data around the clock, so restricting it to office hours is the wrong instinct. This is where HROne’s exit clearance workflow and India-compliant payroll do the heavy lifting: FnF, asset recovery, and auto PF, ESI, and TDS calculations run across multi-state entities, so the two-day clock is met by the system, not by a stressed HR executive at month-end. Peers researching options often start by navigating the changing labour laws.
Get exits right, and you remove one of the quietest attrition drivers hiding in your process.
Q9. What does a data-driven retention playbook look like for blue-collar and field teams in India?
Blue-collar and field attrition needs a different data playbook. Attendance fraud (buddy punching, GPS spoofing), daily-wage payout accuracy, and no-desk workforces mean your risk signals shift to shift-adherence, geo-fenced attendance, and payout timeliness. Manufacturing attrition sits around 10% to 14% and e-commerce near 28.7%, so role-based data capture, not one uniform policy, is what actually retains field teams.
🏭 The situation: a whole week lost to attendance
Picture a plant HR lead at month-end. Before payroll can even start, the team burns a full week, with two or three people, just fetching attendance from scattered machines and sheets.
That is not a people strategy. That is survival. When your workforce has no desk and no laptop, the data white-collar playbooks assume simply does not exist in one place, which is why accurate attendance tracking becomes the foundation.
⚠️ The complication: fraud and wrong payouts drive exits
Here is what breaks retention for field teams. The risk signals are different, so the failures are different too.
- Attendance fraud: buddy punching (one worker clocking in for another) and GPS spoofing quietly inflate paid days.
- Daily-wage payout accuracy: a field worker paid per shift feels every rupee of error immediately, and a wrong payout is a next-day resignation.
- No-desk visibility: managers cannot see shift-adherence, so problems surface only after people quit.
The stakes are real. Manufacturing attrition runs about 10% to 14%, while e-commerce field roles push near 28.7%. Uniform policy is the enemy here. As I have said before, equality feels safe, but a field executive and a payroll analyst do not need the same rules, so attendance fraud prevention has to be role-specific.
🛰️ The resolution: capture data by role, not by habit
The fix is role-based capture. Some roles need a dual punch (in and out), while for others, a single punch is more than enough. Forcing one rule on everyone is exactly what creates the fraud gaps.
Layer on geo-fenced attendance (a virtual boundary that validates where a punch happens) and offline sync for low-connectivity sites. Now the data captures itself, and HR stops chasing it, which is the promise of a geofencing attendance system.
This is the most natural fit for HROne in the whole guide. Our attendance management module handles dual or single punch by role, geo-tracking, and offline attendance that auto-syncs when connectivity returns, feeding India-compliant daily-wage payroll software directly, which is why field-heavy teams see it working on the ground. It fits manufacturing HR and logistics HR realities especially well.
“My most liked feature is the GPS-based login and logout with pinpoint accuracy. It helps me track my on-field employees status, like where they are currently.”
— Krunal S., HROne G2 – Verified Review
“Real time sync of biometric punch details of employees working at field locations.”
— Manna S., HROne G2 – Verified Review
“Mobile mark attendance is a way forward to mark attendance from mobile, best for employees who are working at remote location.”
— Mohit S., HROne G2 – Verified Review
Get the field data right, and retention stops being a guessing game.
Q10. What can you do on Monday morning to start reducing attrition with data?
Start small this week: unify your five predictive fields into one sheet, run attrition by manager (not just org-wide), flag the 12-to-24 month tenure band, add two payroll-accuracy checks, and swap one annual review for continuous recognition. You do not need a data-science team or a six-figure platform to begin. You need the right five columns and the discipline to act on the 20% regrettable exits.
✅ Five moves you can make this week
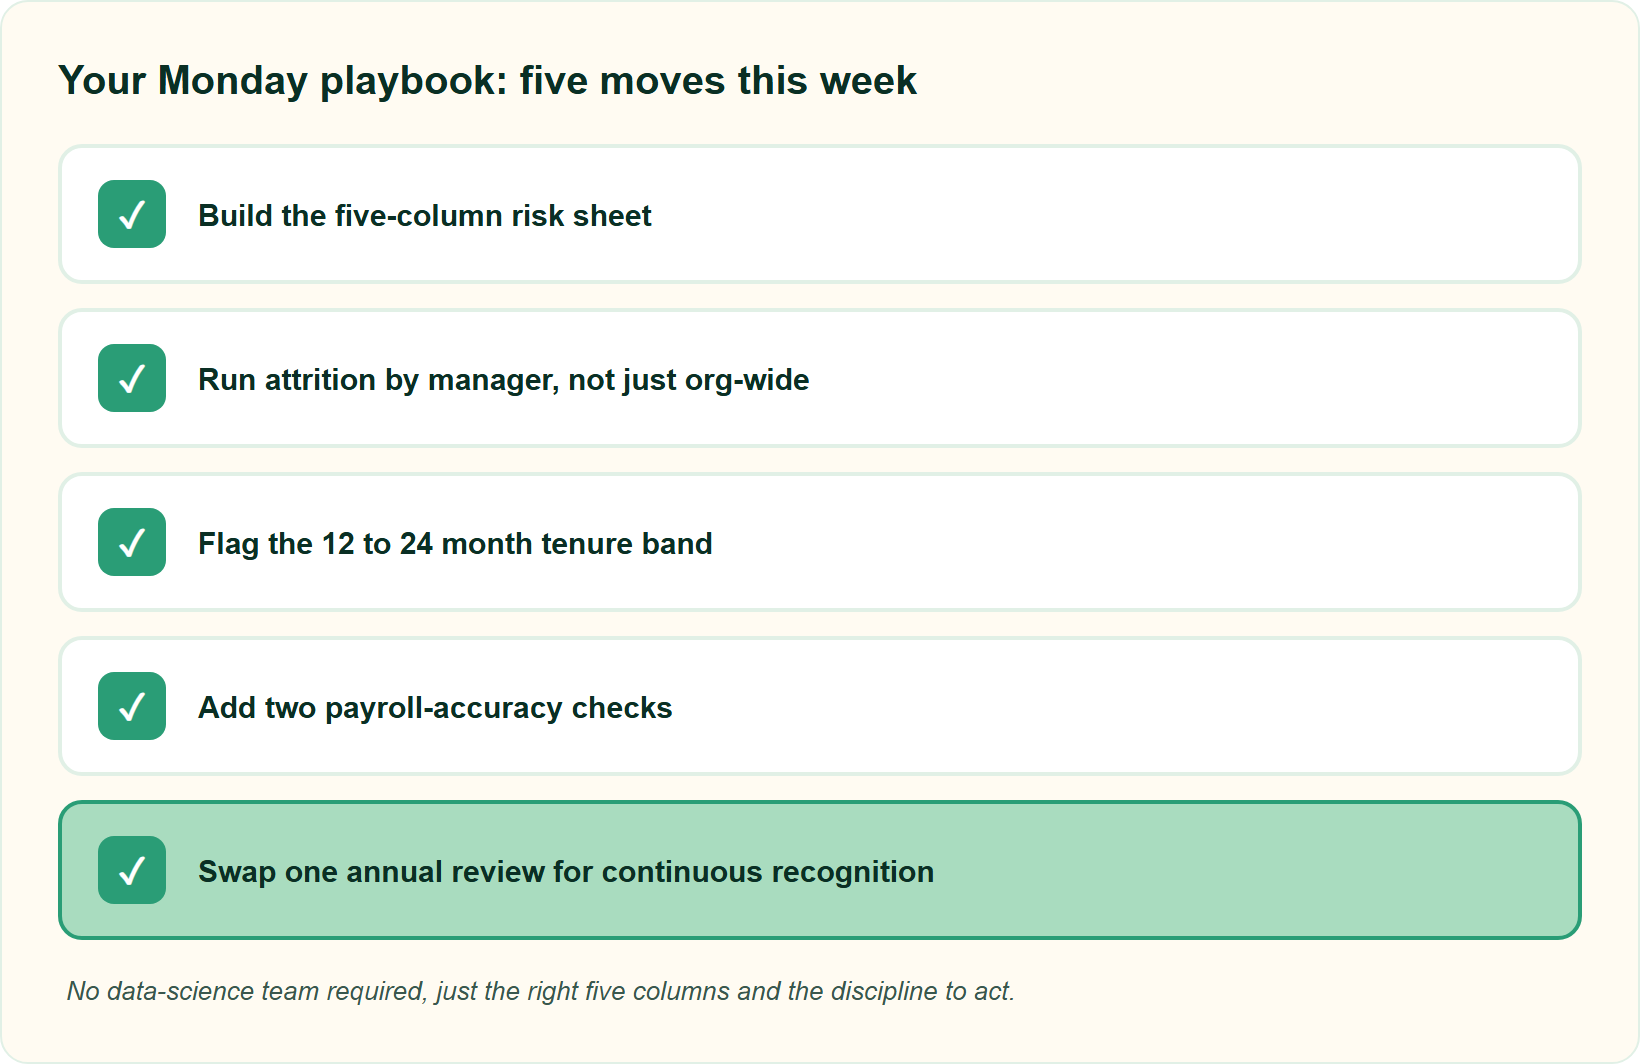
None of these need budget approval. They need an hour and a decision to act.
- Build the five-column sheet. Compensation, satisfaction, work environment, performance trend, and time-since-promotion, all validated predictors on Indian data.
- Run attrition by manager. Not just org-wide. One team usually hides in the average.
- Flag the 12-to-24 month band. This tenure window is consistently the highest-risk zone.
- Add two payroll-accuracy checks. A wrong payslip is a resignation trigger, so catch errors before disbursement.
- Swap one annual review for continuous recognition. Small, frequent “pats on the back” move engagement more than a yearly form.
🎯 Spend your energy on the 20% that matters
Here is the filter I keep coming back to. Roughly 20% of exits are genuinely regrettable, and about 80% are not.
So do not try to save everyone. Point your five columns and your manager cuts at that 20%, and let the rest go without guilt. That discipline is what makes a small playbook actually work, and it pairs well with continuous feedback over annual reviews.
🌉 When the spreadsheet stops scaling
The manual sheet is the right way to start. It is honest, cheap, and it teaches you what your data actually says. My current thinking, though, is that it has a ceiling.
That ceiling arrives the month fetching and trusting the data becomes the bottleneck, not the analysis. When you are spending a week reconciling numbers instead of acting on them, that is the signal to automate. This is the moment HROne’s workforce management and performance management analytics take over the run-around, surfacing flight-risk, tenure-band, and manager-level patterns in one place so HR gets its time and mental space back.
Here is the question I am sitting with. If most Indian exits are controllable and visible in data you already own, what is really stopping us from catching them, the tools or the will to act? Tell me where your attrition data breaks first, and I will show you the exact report to build.















 Secures Top Spot in
